Green vehicles on our roads

Oil from well to tank
KEY MESSAGES
- PETROL AND DIESEL ARE COOKING THE PLANET
- TRAFFIC ON OUR ROADS IS KILLING PEOPLE
- ELECTRIC VEHICLES MUST BE PART OF A CLEAN ELECTRICITY SUPPLY
- WALKING AND CYCLING IS BEST WHERE POSSIBLE
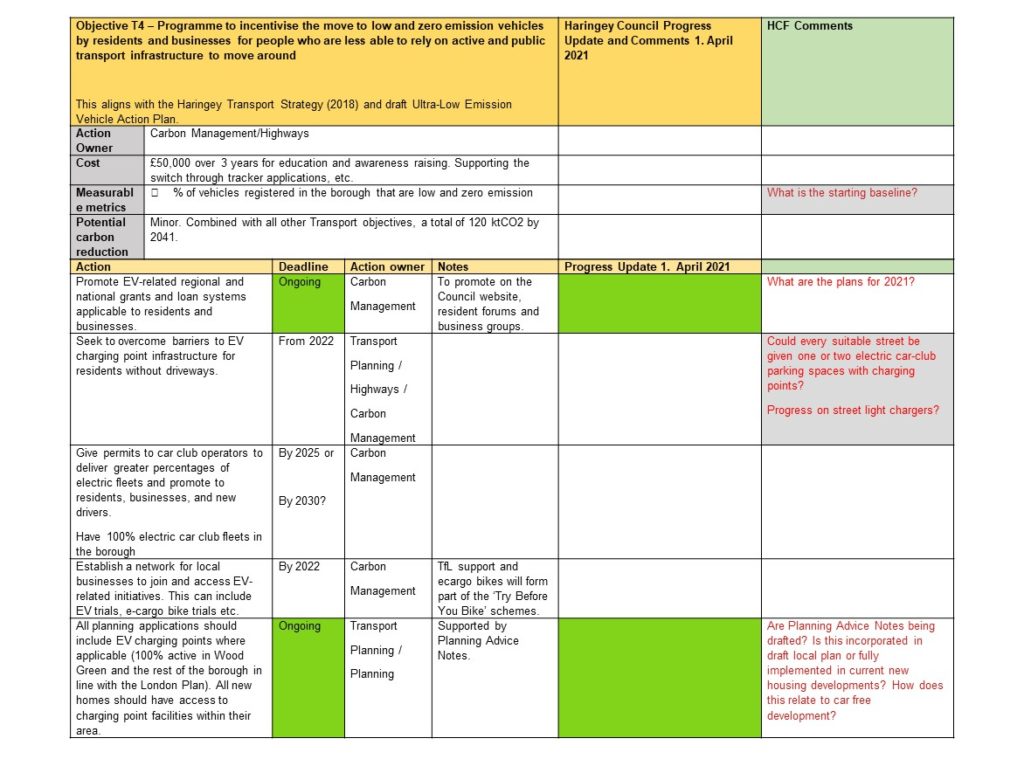
Haringey Council’s proposed action are in the ‘pink stripes’ below.
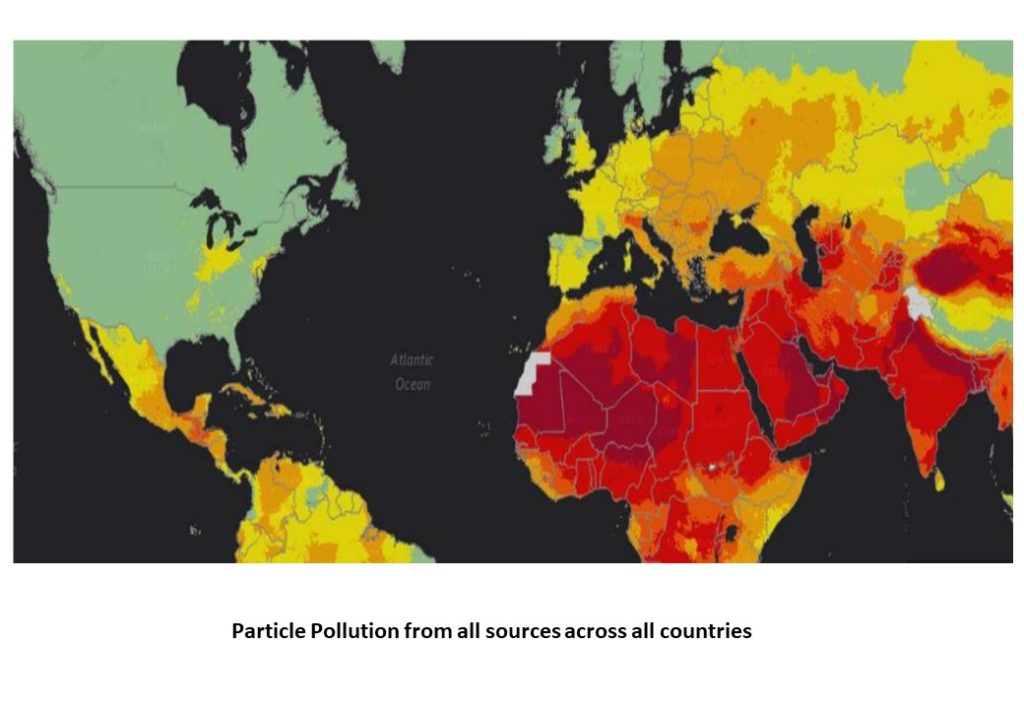
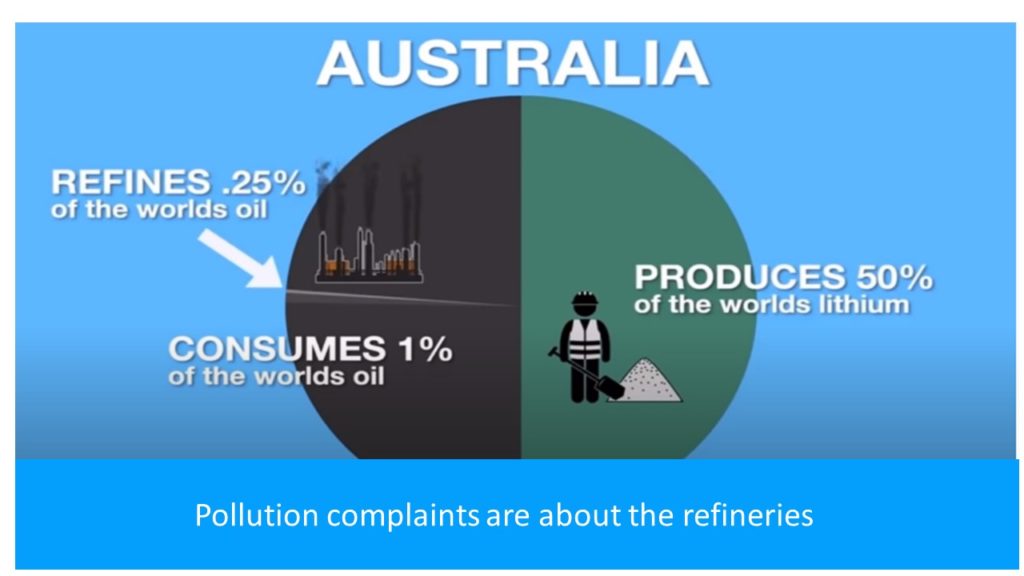
Oil – From Well to Tank. Fully Charged and Gas Troll circulated this video in Feb 2021, that is summarised in the picture above. It explains simply and graphically how the dirty emissions due to oil add up compared with (clean) electric. And Researchgate in Aug 2018 also detailed carbon emissions at each stage from well to tank. 1.getting a barrel of oil to the refinery, 2.refining oil, 3.transporting the stuff to a gas pump, 4.driving
The cabinet member in Haringey responsible for strategic transport, Low Traffic Neighbourhoods, School Streets and for reducing transport carbon and Air Quality is Cllr Mike Hakata at mike.hakata@haringey.gov.uk
For parking, parking transformation, street scene improvement and the public realm is Cllr Seema Chandwani at seema.chandwani@haringey.gov.uk;
For public health (ie air pollution aspects) is Cllr Lucia Das Neves at lucia.dasneves@haringey.gov.uk
The council department for Smarter Travel is at smarter.travel@haringey.gov.uk and department for Pollution is pollution@haringey.gov.uk.
Governments’ roles
Governments across the world should collaborate on the fastest move from internal combustion engines to electric vehicles, with low carbon lifecycles and on fairtrade standards for materials. The UK could show leadership in negotiations leading up to COP26 in Glasgow in Nov 2021.
Meanwhile Governments merely reduce emissions slowly slowly.
Cars and Vans
EMISSIONS:
medium electric car 53g/Km
medium petrol 192g/Km
medium diesel 172g/km ,
average van 167g/Km*

OFFSET
For those that can afford to pay more for their motoring offsetting could consist of:
- paying more for an electric car
- increase in renewables by installing solar panels
- or by investing in renewable schemes
- or by switching to genuinely 100% renewables electricity.
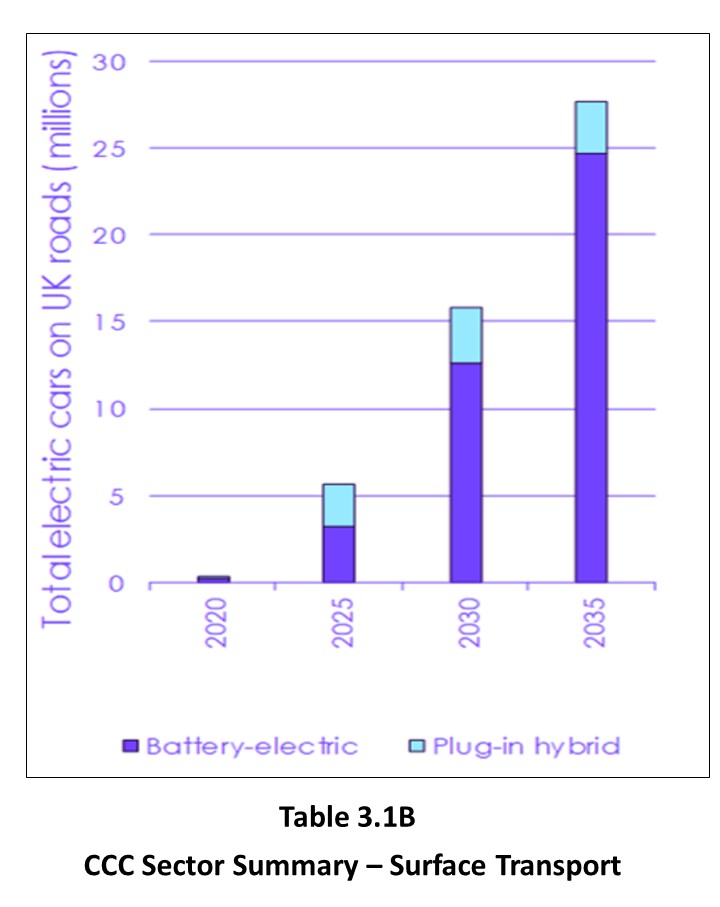
The National Grid Future Energy Scenario 2020 says that “It’s estimated there will be over 11 million electric vehicles on British roads by 2030 (and over 30m by 2040) in the most stretching net zero scenarios.”
For the UK, the Committee on Climate Change says here that the “DfT has signalled its intention to retain emissions standards that are at least as ambitious as those in the EU” and those EU regulations for CO2 emissions per km for new cars are for:
- 2021 – 95gCO2/km
- 2025 – 15% less
- 2030 – 37.5% less and new petrol and diesel cars will no longer be allowed
And for new vans (Average van emissions in 2018 were 167gCO2/km) CO2 emissions per km for ‘a fleet average’ to be:
- 2021 – 147gCO2/km
- 2025 – 15% less
- 2020 – 31% less
The CCC’s Sector Surface Transport report says that “Relative to the baseline, our scenarios assume that there is potential for a 1-4% reduction in total car mileage by 2030, and between 4% and 12% by 2050.” This assumes that “5-7% of car journeys could be shifted to walking and cycling (including e-bikes) by 2030, rising to 9-14% by 2050.”
And Page 34 “Average car-kilometres decrease by 6% by 2030, and this demand reduction increases gradually to 17% by 2050. Demand reduction for vans is lower, reaching 3% from 2030 onwards. Improved speed limit enforcement gives efficiency savings of 2% from 2025.”
Batteries
Charging
The best place to go to find out where EV chargepoints are, whether they are available and whether rapid or slow is Zap Map.
Thinking about a next car/van?
UK Policies that Slow/Speed the Transition
Average Bus Journeys: 105g/Km
So travelling by bus causes much lower emissions than driving. However the figure of 105g/Km would have been based on older buses that were fuelled by diesel and caused high levels of air pollution all along their routes. As evidence of causing air pollution, the Evening Standard reported that during 2016, when Transport for London introduced 70% of electric or greener buses along Oxford St NO2 reduced by 30%.

Transport for London (TfL), funded through the GLA, determines the network of services which are provided, under contracts for specific routes, by private sector operators.” The Department for Transport explains here that “Buses in London, unlike the rest of England, are franchised.”
TfL has a list of the many operators who run buses in London.
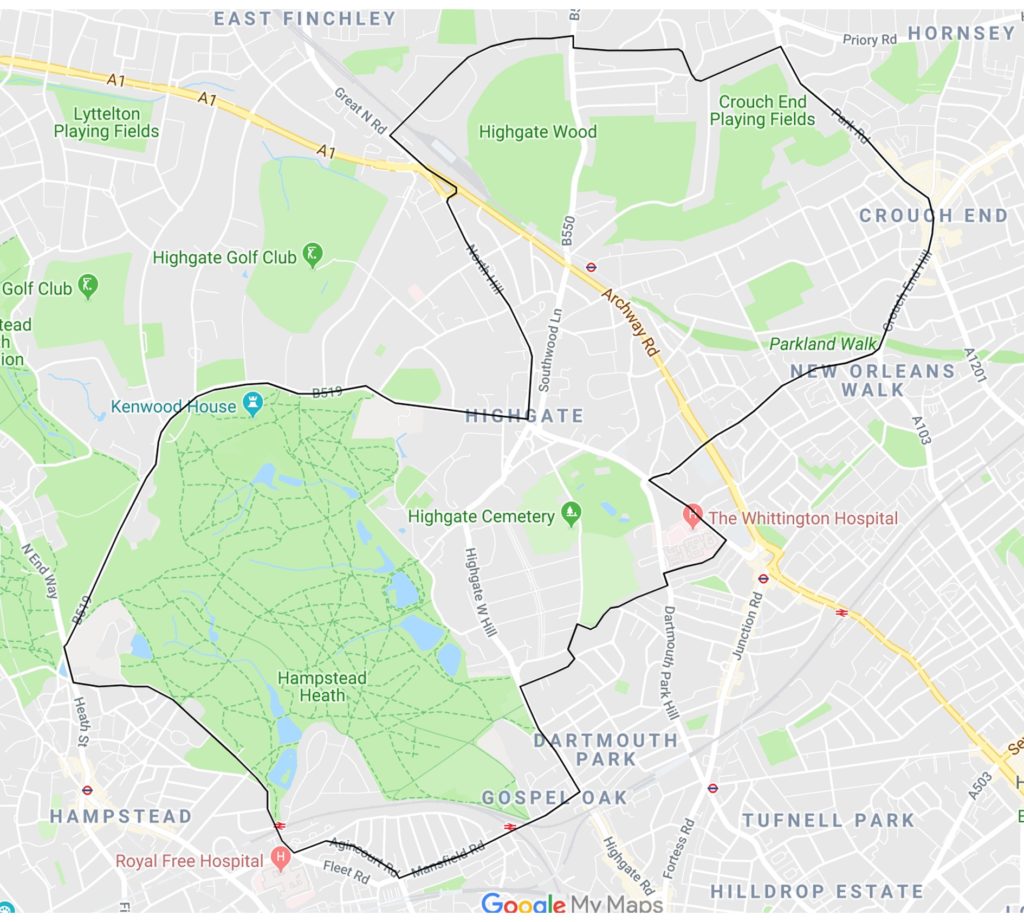
Haringey's Buses

Trucks and Heavy Goods Vehicles
Emission standards for trucks (lorries) and buses are defined by engine energy output output in g/kWh, unlike the emission standards of g/km for passenger cars and light commercial vehicles.

OFFSET
Moving to electric trucks might have a higher upfront cost but would state the sustainability credentials of the company
